Hospitality
The Mood Method Scorecard: Hosting Metrics That Matter
By Jillian Mood6 min read
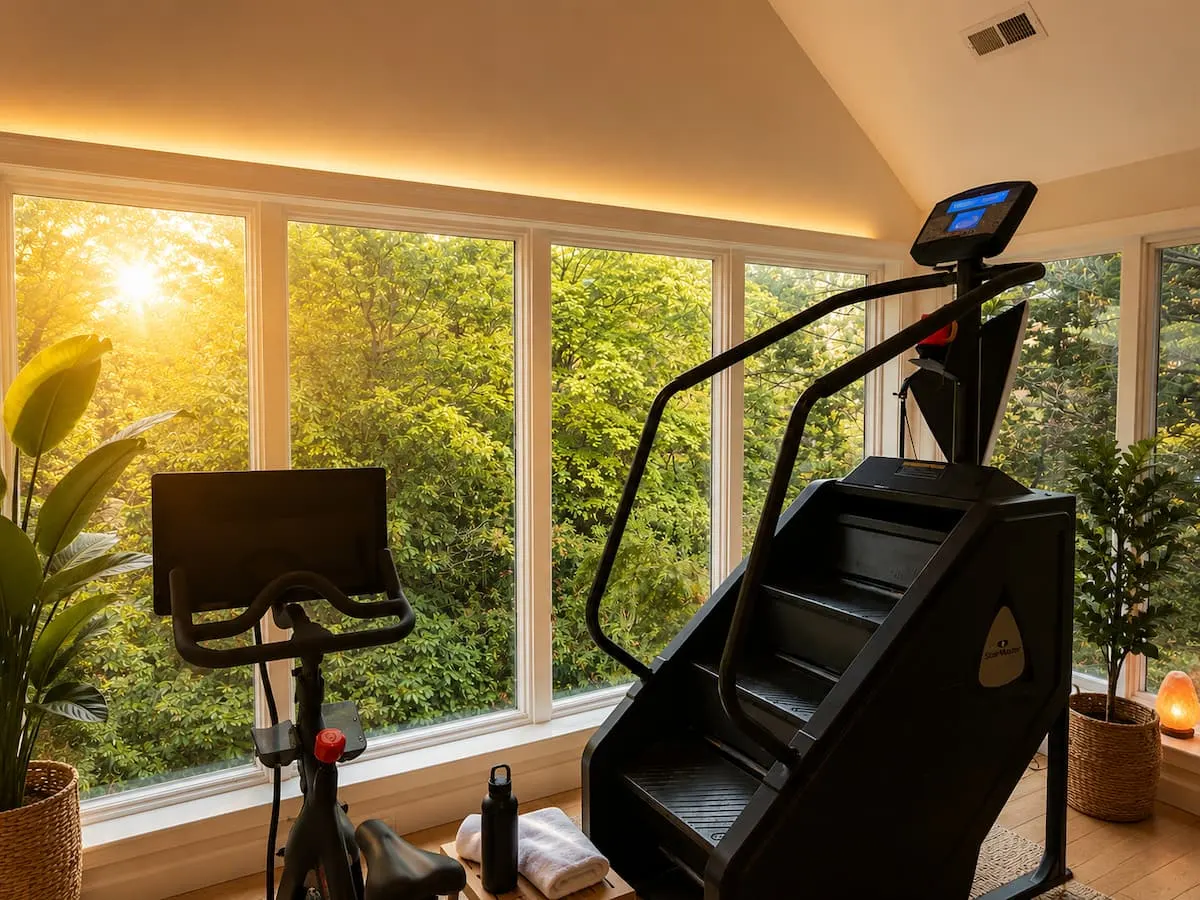
The gym in the Southborough house has a Peloton that tells you, to the watt, how the ride went. Hospitality deserves the same honesty. "Guests seem happy" is a feeling, and I would rather have a number I can look at on a Monday morning.
So each home gets a one-page scorecard, a few measures per pillar of the Mood Method. The money side (occupancy, nightly rate, revenue) lives in the metrics that matter. This page tracks the hospitality that earns it.
Start with what Airbnb already counts
Airbnb hands every host a free dashboard. Know exactly what it measures, and what it misses.
Category ratings. Guests rate six categories plus an overall score, and Airbnb's ratings page spells out the question behind each one. Cleanliness: did the home meet the standard? Accuracy: was it represented with up-to-date photos and information, and was everything in working order? Check-in: was it easy? Communication: did the host respond promptly? Location: was the guest made aware of things like transport and noise? Value: was it worth the price? One detail surprises people. The overall rating is its own category and not an average of the others.
Response rate and response time. Per Airbnb's help page, response rate is the share of new inquiries and reservation requests you answered within 24 hours over the past 30 days. Response time is your average time to respond to new messages. Follow-up messages in a conversation do not count toward either. In other words, Airbnb's number says nothing about how fast you answer a guest who is standing in your kitchen. That one you track yourself.
Superhost criteria. Reviewed every three months: a 4.8 or higher overall rating, 90% of new messages answered within 24 hours, a cancellation rate under 1%, and at least 10 stays (or 3 reservations totalling 100 nights).
Guest Favorite factors. The Guest Favorites page lists overall ratings, category ratings, host cancellation rate, review removal rate and quality-related incidents reported to customer service, with a minimum of 5 reviews. If the badge is a goal, here is how I think about earning it.
Those are lagging numbers. They tell you how the last few months went. The scorecard adds leading numbers, the ones that move first.
The scorecard, pillar by pillar
M: Make it better, every stay
- Ask rate. The share of stays where we asked "how could we have done better?" The target is every stay, including the five-star ones.
- Reasonable suggestions per stay. Expect this to rise when you first start asking, because you are finally hearing what guests used to keep to themselves. Then watch it fall. Our own observation is that the better we get at this, the fewer suggestions guests have left to make. That is an observation from our homes, and I would not call it a law.
- Closed before next arrival. Of the suggestions we accepted, how many were fixed before the next guest walked in.
The habit behind these numbers is in kaizen for hosts.
O: Omotenashi
Anticipation is hard to count, so count its absence.
- Avoidable questions per stay. Every "how does the projector work?" or "where are the extra blankets?" is something the manual, the labels or a message could have answered first. Each one is an edit waiting to happen.
- Occasion known. The share of stays where we knew why they were coming before they arrived. You cannot set a house for a birthday nobody told you about.
- Accuracy and Check-in ratings. These two are Airbnb's closest measures of "nothing left to figure out".
O: On-the-hour answers
- Replies within the hour. Count every guest message during waking hours: inquiries, mid-stay questions and post-stay notes. Track the percentage answered within 60 minutes and the median time to first reply.
- Airbnb's displayed response rate and time. My profile shows 100% and "responds within an hour" (September 2026), and I still keep my own count, for the reason above.
- Communication rating.
Airbnb's ground rules expect a reply within 1 hour for time-sensitive issues during a stay, so this pillar doubles as platform compliance.
D: Details and delight
- Issue rate per stay. An issue is anything a guest reported as broken, missing or not clean. Divide by stays. A house that sleeps 14 will not sit at zero forever. The trend is what matters.
- Found by us vs. found by guests. Log who caught each problem: the turnover, a spot check, or the guest. You want the first two piles growing and the third shrinking. It is the most motivating number on the page, because the team can move it this week. Our spot checks include audits and random surprise inspections, which is how the second pile grows.
- Reset score and maintenance on time. The turnover checklist scored at each reset, and the share of calendar tasks done in their month.
- Delight mentions. How many reviews and messages name your signature thing? A library, a pinball machine, a fire pit with s'mores supplies. If guests never mention it, it may not be landing, or it may need a better introduction in the manual.
- Cleanliness rating.
The loop: do they come back?
The four pillars form a loop, and the loop has its own measures: repeat bookings, guests who say a friend sent them, and reviews that talk about returning. Airbnb's highlight on my Southborough listing ends with the words "with many planning return visits", and that phrase matters more to me than any decimal.
Then the headline numbers: overall rating and badge status. Ratings and revenue do travel together in market data. AirROI's March 2026 table for Nashville shows listings rated 4.9 and up earning $42,935 a year against $33,669 for those rated 4.70 to 4.79. That is a correlation in one market, so it proves nothing about cause, and I unpack it in what a 4.9 is worth.
Keep the scorecard without it keeping you
- One sheet, one row per stay. Columns: dates, occasion, questions asked, issues (and who found them), minutes to first reply on the slowest message, suggestions, what we changed. Five minutes after each checkout.
- Review monthly, act weekly. The row is for fixing things now. The month view is for spotting patterns.
- Respect small samples. With 20 reviews, one four-star moves the average more than it deserves to. Read the words and watch the direction. Decimals need more data than most single homes produce in a season.
- Never trade stars for favours. Asking how to improve is welcome. Pressuring a guest about their rating is not, and guests can tell the difference.
- Share it with the team. The cleaners and the handyman earned these numbers with you. A scorecard works as a team trophy and fails as a report card.
Measure the things a guest would thank you for, and the things Airbnb measures tend to follow.
This scorecard is one of the working tools of the Mood Method seminar. Start with three numbers if nine feels like a lot: replies within the hour, issues per stay, and suggestions per stay. Give them a season, and let them show you where to look next.
Sources
- Airbnb Help Center: Ratings for homes
- Airbnb Help Center: Improve your response rate and response time
- Airbnb Help Center: What's required to be a Superhost
- Airbnb Help Center: Guest favorites and highlights
- Airbnb Help Center: Ground rules for home hosts (checked September 2026)
- AirROI: Airbnb Rating Revenue Cliff, 2026 (Nashville table, March 2026)

Want this done for your home?
Everything in this article is part of what Jillian does for the homes she hosts. Tell her about yours and she will tell you, honestly, what she would do with it.